
Page 81 - Concepts of Reasoning-8
P. 81
CHAPTER
Data Analysis 2
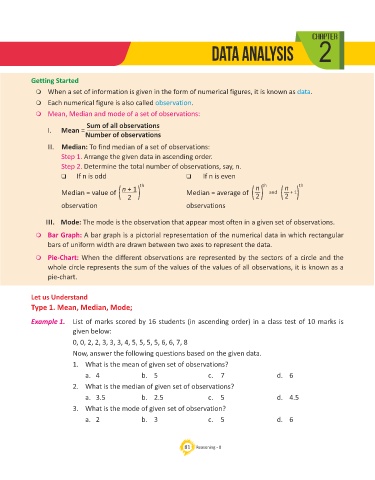
Getting Started
m When a set of information is given in the form of numerical figures, it is known as data .
m Each numerical figure is also called observation .
m Mean, Median and mode of a set of observations:
Sum of all observations
I. Mean =
Number of observations
II. Median: To find median of a set of observations:
Step 1. Arrange the given data in ascending order.
Step 2. Determine the total number of observations, say, n.
q If n is odd q If n is even
( ) th ( ) th ( ) th
n
n
n + 1
Median = value of 2 Median = average of 2 and 2 + 1
observation observations
III. Mode: The mode is the observation that appear most often in a given set of observations.
m Bar Graph: A bar graph is a pictorial representation of the numerical data in which rectangular
bars of uniform width are drawn between two axes to represent the data.
m Pie-Chart: When the different observations are represented by the sectors of a circle and the
whole circle represents the sum of the values of the values of all observations, it is known as a
pie-chart.
Let us Understand
Type 1. Mean, Median, Mode;
Example 1. List of marks scored by 16 students (in ascending order) in a class test of 10 marks is
given below:
0, 0, 2, 2, 3, 3, 3, 4, 5, 5, 5, 5, 6, 6, 7, 8
Now, answer the following questions based on the given data.
1. What is the mean of given set of observations?
a. 4 b. 5 c. 7 d. 6
2. What is the median of given set of observations?
a. 3.5 b. 2.5 c. 5 d. 4.5
3. What is the mode of given set of observation?
a. 2 b. 3 c. 5 d. 6
81 Reasoning - 8