
Page 70 - Concepts of Reasoning-8
P. 70
CHAPTER
Worksheet-14.1 graphs 14
Line Graphs Interpretation and Plotting
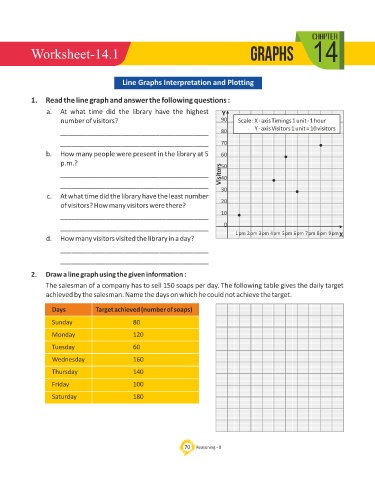
1. Read the line graph and answer the following questions :
a. At what time did the library have the highest Y
number of visitors? 90 Scale : X - axis Timings 1 unit - 1 hour
Y - axis Visitors 1 unit = 10 visitors
_______________________________________ 80
_______________________________________ 70
b. How many people were present in the library at 5 60
p.m.?
50
_______________________________________ Visitors 40
_______________________________________
30
c. At what time did the library have the least number
20
of visitors? How many visitors were there?
10
_______________________________________
_______________________________________ 0
1 pm 2 pm 3 pm 4 pm 5 pm 6 pm 7 pm 8 pm 9 pm X
d. How many visitors visited the library in a day?
_______________________________________
_______________________________________
2. Draw a line graph using the given information :
The salesman of a company has to sell 150 soaps per day. The following table gives the daily target
achieved by the salesman. Name the days on which he could not achieve the target.
Days Target achieved (number of soaps)
Sunday 80
Monday 120
Tuesday 60
Wednesday 160
Thursday 140
Friday 100
Saturday 180
70 Reasoning - 8