
Page 72 - Concepts of Reasoning-8
P. 72
Worksheet-14.3
Bar Graph and Pie Chart
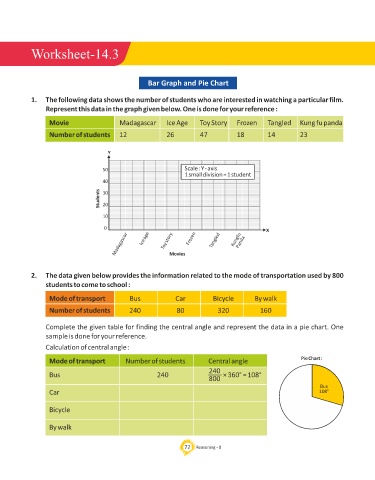
1. The following data shows the number of students who are interested in watching a particular film.
Represent this data in the graph given below. One is done for your reference :
Movie Madagascar Ice Age Toy Story Frozen Tangled Kung fu panda
Number of students 12 26 47 18 14 23
Y
50 Scale : Y - axis
1 small division = 1 student
40
Students 30
20
10
0 X
Madagascar Ice age Toy story Movies Frozen Tangled Kungfu Panda
2. The data given below provides the information related to the mode of transportation used by 800
students to come to school :
Mode of transport Bus Car Bicycle By walk
Number of students 240 80 320 160
Complete the given table for finding the central angle and represent the data in a pie chart. One
sample is done for your reference.
Calculation of central angle :
Mode of transport Number of students Central angle Pie Chart :
240
Bus 240 × 360° = 108°
800
Bus
Car 108°
Bicycle
By walk
72 Reasoning - 8