Page 74 - Concepts of Reasoning-8
P. 74

CHAPTER

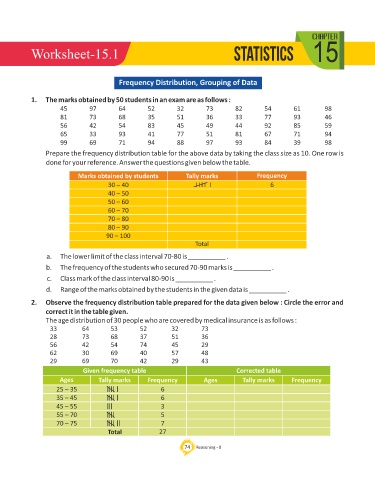
            Worksheet-15.1                                                        Statistics                 15


                                          Frequency Distribution, Grouping of Data


            1.  The marks obtained by 50 students in an exam are as follows :
                      45        97        64        52        32        73        82        54         61        98
                      81        73        68        35        51        36        33        77         93        46
                      56        42        54        83        45        49        44        92         85        59
                      65        33        93        41        77        51        81        67         71        94
                      99        69        71        94        88        97        93        84         39        98
                 Prepare the frequency distribution table for the above data by taking the class size as 10. One row is
                 done for your reference. Answer the questions given below the table.

                              Marks obtained by students         Tally marks              Frequency
                                        30 – 40                                               6
                                        40 – 50
                                        50 – 60
                                        60 – 70
                                        70 – 80
                                        80 – 90
                                        90 – 100
                                                                     Total

                 a.  The lower limit of the class interval 70-80 is __________ .
                 b.  The frequency of the students who secured 70-90 marks is __________ .
                 c.  Class mark of the class interval 80-90 is __________ .

                 d.  Range of the marks obtained by the students in the given data is __________ .
            2.  Observe the frequency distribution table prepared for the data given below : Circle the error and
                 correct it in the table given.
                 The age distribution of 30 people who are covered by medical insurance is as follows :
                  33         64        53        52         32         73
                  28         73        68        37         51         36
                  56         42        54        74         45         29
                  62         30        69        40         57         48
                  29         69        70        42         29         43
                              Given frequency table                                Corrected table
                      Ages         Tally marks      Frequency          Ages          Tally marks      Frequency
                     25 – 35                             6
                     35 – 45                             6
                     45 – 55                             3
                     55 – 70                             5
                     70 – 75                             7
                                      Total             27


                                                                 74  Reasoning - 8
   69   70   71   72   73   74   75   76   77   78   79