
Page 71 - Concepts of Reasoning-8
P. 71
Worksheet-14.2
Co-ordinates of a Point and Linear Graph
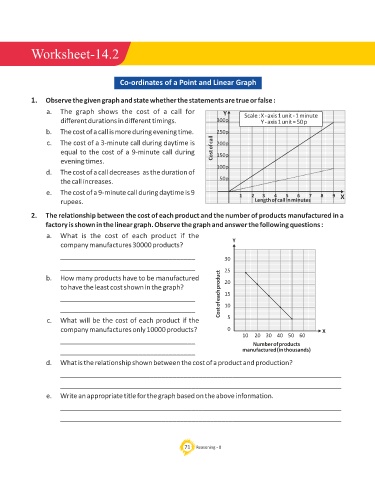
1. Observe the given graph and state whether the statements are true or false :
a. The graph shows the cost of a call for Y Scale : X - axis 1 unit - 1 minute
different durations in different timings. 300p Y - axis 1 unit = 50 p
b. The cost of a call is more during evening time. 250p
c. The cost of a 3-minute call during daytime is 200p
equal to the cost of a 9-minute call during Cost of call 150p
evening times.
100p
d. The cost of a call decreases as the duration of
the call increases. 50p
e. The cost of a 9-minute call during daytime is 9
1 2 3 4 5 6 7 8 9 X
rupees. Length of call in minutes
2. The relationship between the cost of each product and the number of products manufactured in a
factory is shown in the linear graph. Observe the graph and answer the following questions :
a. What is the cost of each product if the
Y
company manufactures 30000 products?
____________________________________ 30
____________________________________ 25
b. How many products have to be manufactured 20
to have the least cost shown in the graph?
____________________________________ Cost of each product 15
____________________________________ 10
c. What will be the cost of each product if the 5
company manufactures only 10000 products? 0 X
10 20 30 40 50 60
____________________________________
Number of products
____________________________________ manufactured (in thousands)
d. What is the relationship shown between the cost of a product and production?
___________________________________________________________________________
___________________________________________________________________________
e. Write an appropriate title for the graph based on the above information.
___________________________________________________________________________
___________________________________________________________________________
71 Reasoning - 8