
Page 59 - Code Craft Computer-7
P. 59
Analyt ical Skills
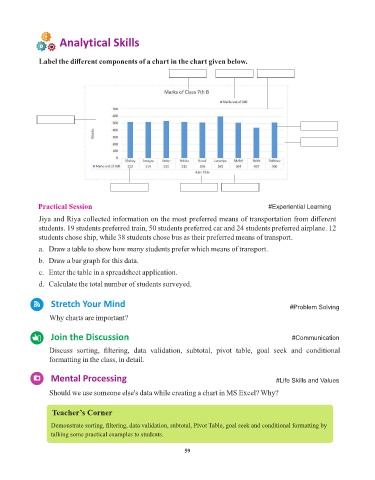
Label the different components of a chart in the chart given below.
Chart title Legend Gridlines
Data series
Chart area
Data table Axis title Category axis
Practical Session #Experiential Learning
Jiya and Riya collected information on the most preferred means of transportation from different
students. 19 students preferred train, 50 students preferred car and 24 students preferred airplane. 12
students chose ship, while 38 students chose bus as their preferred means of transport.
a. Draw a table to show how many students prefer which means of transport.
b. Draw a bar graph for this data.
c. Enter the table in a spreadsheet application.
d. Calculate the total number of students surveyed.
Stretch Your Mind #Problem Solving
Why charts are important?
Join the Discussion #Communication
Discuss sorting, filtering, data validation, subtotal, pivot table, goal seek and conditional
formatting in the class, in detail.
Mental Processing #Life Skills and Values
Should we use someone else's data while creating a chart in MS Excel? Why?
Teacher’s Corner
Demonstrate sorting, filtering, data validation, subtotal, Pivot Table, goal seek and conditional formatting by
talking some practical examples to students.
59