
Page 55 - Code Craft Computer-7
P. 55
Area Charts: Area charts are similar to line charts but the
data point markers are not displayed and the area beneath the
lines is filled with colour. An area chart emphasizes the
magnitude of change in data over time. It is mainly used for
representing sales and production figures.
Surface Charts: Surface charts allow you to display data across
a 3D landscape. These work best with large data sets, allowing
you to see a variety of information at the same time.
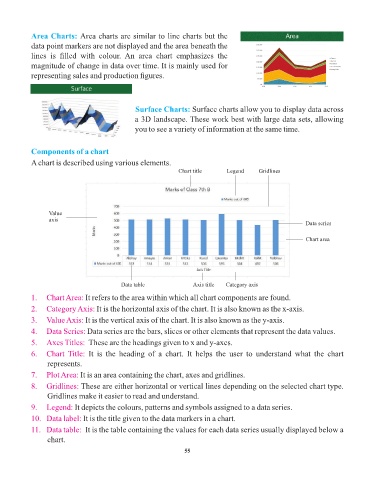
Components of a chart
A chart is described using various elements.
Chart title Legend Gridlines
Value
axis
Data series
Chart area
Data table Axis title Category axis
1. Chart Area: It refers to the area within which all chart components are found.
2. Category Axis: It is the horizontal axis of the chart. It is also known as the x-axis.
3. Value Axis: It is the vertical axis of the chart. It is also known as the y-axis.
4. Data Series: Data series are the bars, slices or other elements that represent the data values.
5. Axes Titles: These are the headings given to x and y-axes.
6. Chart Title: It is the heading of a chart. It helps the user to understand what the chart
represents.
7. Plot Area: It is an area containing the chart, axes and gridlines.
8. Gridlines: These are either horizontal or vertical lines depending on the selected chart type.
Gridlines make it easier to read and understand.
9. Legend: It depicts the colours, patterns and symbols assigned to a data series.
10. Data label: It is the title given to the data markers in a chart.
11. Data table: It is the table containing the values for each data series usually displayed below a
chart.
55