
Page 57 - Code Craft Computer-7
P. 57
Changing the chart type or sub-type
To change the chart type or sub-type, click on the chart and follow these steps:
1. Select the chart.
2. Click on the Chart Design tab.
3. Click on the Change Chart Type in
the Type group.
4. The Change Chart Type dialog box
appears. Click and select a new chart
type or sub-type.
The chart type gets changed.
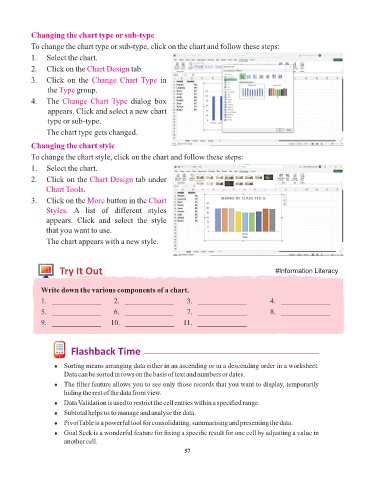
Changing the chart style
To change the chart style, click on the chart and follow these steps:
1. Select the chart.
2. Click on the Chart Design tab under
Chart Tools.
3. Click on the More button in the Chart
Styles. A list of different styles
appears. Click and select the style
that you want to use.
The chart appears with a new style.
Try It Out #Information Literacy
Write down the various components of a chart.
1. _____________ 2. _____________ 3. _____________ 4. _____________
5. _____________ 6. _____________ 7. _____________ 8. _____________
9. _____________ 10. _____________ 11. _____________
Flashback Time
¨ Sorting means arranging data either in an ascending or in a descending order in a worksheet.
Data can be sorted in rows on the basis of text and numbers or dates.
¨ The filter feature allows you to see only those records that you want to display, temporarily
hiding the rest of the data from view.
¨ Data Validation is used to restrict the cell entries within a specified range.
¨ Subtotal helps us to manage and analyse the data.
¨ PivotTable is a powerful tool for consolidating, summarising and presenting the data.
¨ Goal Seek is a wonderful feature for fixing a specific result for one cell by adjusting a value in
another cell.
57